✍️ Author: Dr Eleni Christoforidou
Home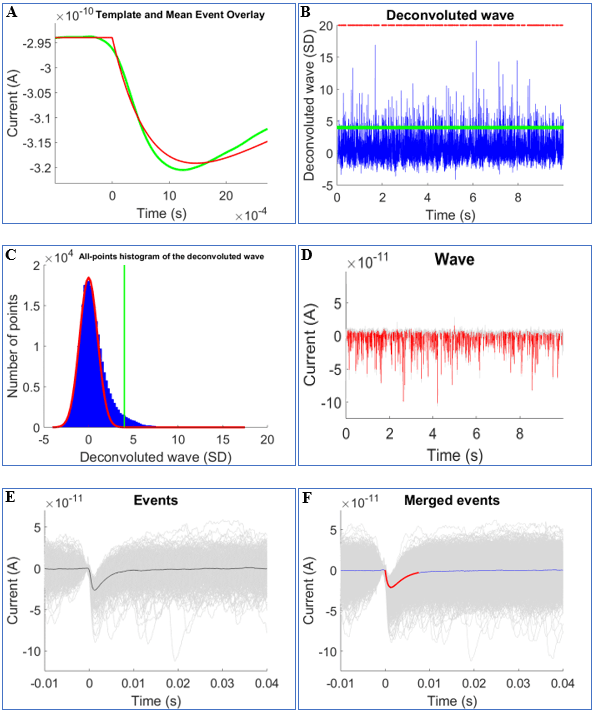
Detection of mEPSCs in a recording from a neuron. (A) Sum of two exponentials template (red) and mean event overlay (green). (B) Deconvoluted wave of the recording (blue), detection threshold (green), and detected events (red dots). (C) All-point histogram of the deconvoluted trace (blue bars) fitted with a Gaussian function (red curve). The detection threshold (green) was set to 4x the standard deviation of the Gaussian. (D) Continuous trace of detected mEPSCs (red). (E) Superimposed detected mEPSCs (grey curves) and the median mEPSC (black curve) during a continuous recording, aligned horizontally to the peak of the deconvolution function. (F) Merged events from entire recording wave with the mean ensemble (blue) and fit (red).
A Day in the Lab: Analysing the Electrical Activity of Neurons using Computer Code
🕒 Approximate reading time: 3 minutes
Today in the lab was primarily a day of analysis, dedicated to the computer, scrutinising the electrical activity of neurons that I had previously recorded during my electrophysiology experiments (you can refer to my previous post here). Today's agenda involved a considerable amount of coding via Matlab software, to compute various parameters like amplitude, frequency, and charge of the neuronal electrical activity. Performing these calculations necessitates a range of intricate mathematical functions, but the procedure is semi-automated thanks to computer code and software specifically designed for this type of analysis. The final product? Intricate graphs visually demonstrating the different components of the data analysis, as depicted below.
An Insight into Today's Data Analysis
Miniature excitatory postsynaptic currents (mEPSCs; essentially the basal electrical activity of neurons) were examined using a deconvolution-based method specifically developed for detecting spontaneous mEPSCs. This approach entails fitting events with a sum of two exponential functions (one each for rise and decay). This template is generated based on the time course of spontaneous synaptic events in the recorded waves, which are then deconvolved from the template using Fourier transformation algorithms. The deconvoluted wave is fitted with a Gaussian function, representing the noise distribution, and the detection threshold is set to four times the standard deviation of this Gaussian. The deconvoluted trace is subsequently scanned for local maxima, which correspond to the detected mEPSCs and their onset times. Subsequently, the median amplitude, frequency, charge, rise time and decay time were calculated for each individual neuron.