✍️ Author: Dr Eleni Christoforidou
Home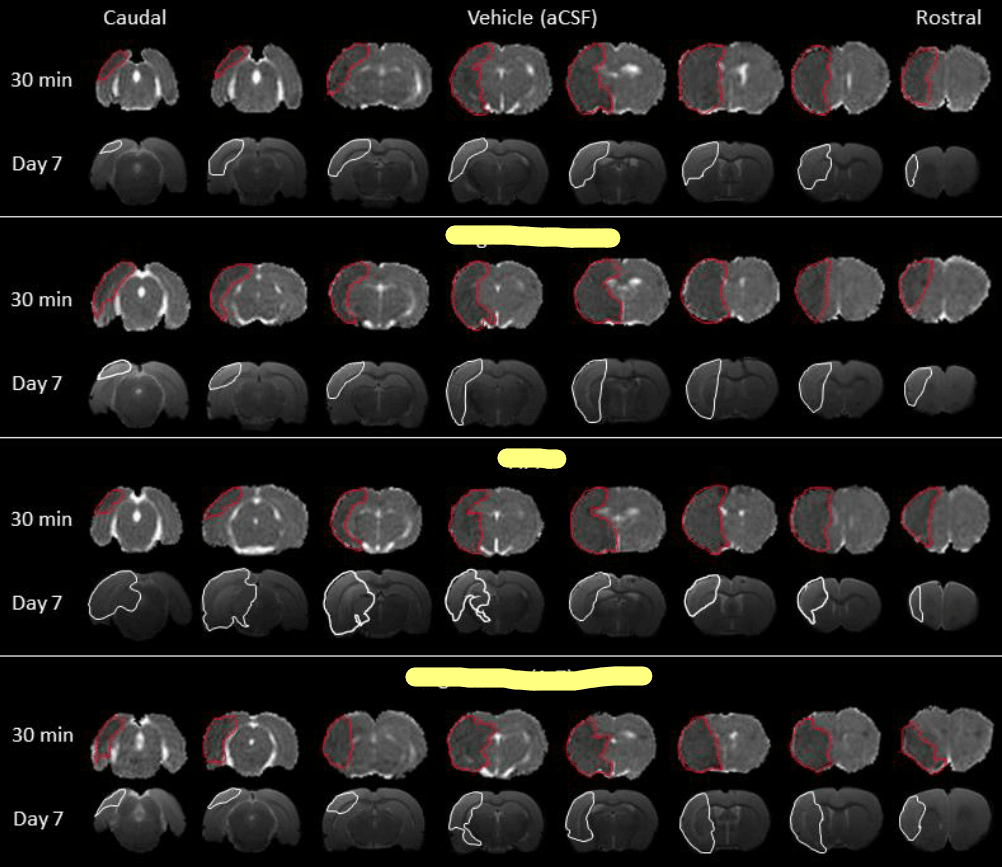
This image exemplifies the image analysis I performed today. These are brain scans taken 30 minutes and 7 days post-stroke, where I've highlighted the areas of brain damage in red and white. For confidentiality reasons, I've concealed the three treatment types.
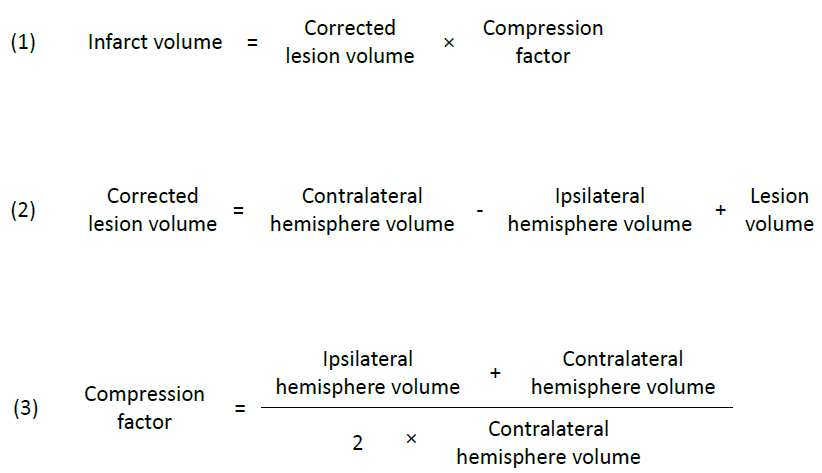
Equations 1, 2, 3
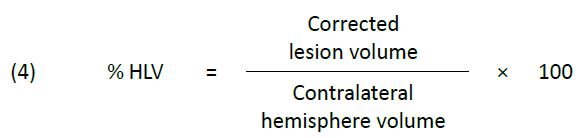
Equation 4
A Day in the Lab: Delving into the World of Image Analysis for Stroke Research
🕒 Approximate reading time: 5 minutes
Today, the lab came alive with the hum of computers as I delved deep into the intricate world of image analysis. The task at hand was to sift through numerous MRI scans, collected during a trailblazing experiment designed to explore potential new treatments for stroke. I've attached an example of these images below to provide a clearer idea of the kind of analysis undertaken. Although a considerable amount of mathematics is involved, the whole process is semi-automated thanks to specialised software designed for this type of analysis. The process, albeit lengthy, offers an exciting journey through the maze of data. In fact, I anticipate spending several more days to complete the entire data set's analysis. Despite the task's enormity, the thrill of familiarising myself with the image analysis software has been a rewarding experience.
Dive into the Details of Today's Image Analysis
(Warning: You're about to dive into a pool of technical details. It's a fascinating read if you have a vested interest in the topic.)
Today's approach to image analysis begins with identifying the initial infarct occurring 30 minutes post-stroke, defined as the hypo-intense area on quantitative apparent diffusion coefficient (ADC) maps. These maps are constructed from diffusion-weighted MRI images. To calculate the initial infarct volume for each brain, we multiplied this area on each slice by the slice thickness and then summed up the values from all eight slices.
Seven days after the stroke, the final infarct was defined by manually delineating the hyperintense area on T2-weighted MRI images. We then multiplied the infarct area from each slice by the slice thickness and summed these to calculate the lesion volume for each brain.
Ischaemic stroke, which leads to the blood-brain barrier's breakdown, results in vasogenic brain oedema due to water influx into the damaged tissue (Ayata and Ropper, 2002). This event causes an extension of the ischaemic brain lesion, accounting for about 30% of the observed infarct volume (Gerriets et al., 2004). To prevent the overestimation of infarct volume from MRI measurements, we corrected initial and final infarct volumes [equation (1)] for swelling of the ipsilateral hemisphere using equation (2) as published in Swanson et al. (1990), and for compression of the contralateral hemisphere using equation (3) as proposed by Gerriets et al. (2004).
Subsequently, we calculated the infarct volume as a percentage of the ipsilateral hemisphere (% hemispheric lesion volume, % HLV) using equation (4) as outlined in Gerriets et al. (2004), to allow for comparison across varying total brain volumes.
Insights into the Experiment
A Diffusion Weighted Imaging (DWI) scan was obtained 30 minutes post-stroke to facilitate quantitative ADC map production and assessment of ischaemic tissue. The treatment was administered intracerebroventricularly via an osmotic pump inserted subcutaneously at the back of the neck, connected to a cannula inserted into the right lateral ventricle via a burr hole drilled in the contralateral skull. Post treatment, recovery was allowed for seven days, after which T2-weighted MRI images were obtained to evaluate the final infarct volume.
MRI plays a pivotal role in diagnosing and managing acute ischemic stroke. DWI, an MRI sequence that uses opposing magnetic field gradients to detect tissue in which water diffusion is restricted due to cytotoxic oedema (Fisher et al., 1992), is a reliable method of detecting acute ischaemia. Cytotoxic oedema, the swelling of neurons, glia, and endothelial cells, occurs due to the release of toxic factors after cerebral injury (Hemphill, Beal, and Gress, 2001). A heightened DWI signal in the brain is typically observed within a few minutes of stroke and leads to a reduction of the ADC value of the tissue, which quantifies the degree of water restriction (Merino and Warach, 2010).
T2-weighted imaging, another type of MRI, is employed to gauge the ischaemic lesion beyond the acute stages. T2-weighted images highlight areas of vasogenic oedema, which signify the infarct's volume. Vasogenic oedema refers to the influx of solutes and fluids into the brain due to the breakdown of the blood-brain barrier (Hemphill, Beal, and Gress, 2001).
References
- Ayata, C. and Ropper, A.D. (2002). Ischaemic brain oedema. Journal of Clinical Neuroscience, 9, pp.113–124.
- Fisher, M., Sotak, C.H., Minematsu, K., Li, L. (1992). New magnetic resonance techniques for evaluating cerebrovascular disease. Annals of Neurology, 32, pp.115-122.
- Gerriets, T., Stolz, E., Walberer, M., Müller, C., Kluge, A., Bachmann, A., Fisher, M., Kaps, M., Bachmann, G. (2004). Noninvasive Quantification of Brain Edema and the Space-Occupying Effect in Rat Stroke Models Using Magnetic Resonance Imaging. Stroke, 35(2), pp.566-571.
- Hemphill, J.C., Beal, M.F., Gress, D.R. (2001). Critical care in neurology. In: Braunwald, E., Fauci, A.S., Kasper, D.L., Hauser, S.L., Longo, D.L., Jameson, J.L., eds. Harrison's Principles of Internal Medicine. 15th ed. Mc Graw Hill: New York. pp. 2491-2498.
- Merino, J.G. and Warach, S. (2010). Imaging of acute stroke. Nature Reviews Neurology, 6, pp.560-571.
- Swanson, R.A., Morton, M.T., Tsao-Wu, G., Savalos, R.A., Davidson, C., Sharp, F.R. (1990). A semiautomated method for measuring brain infarct volume. Journal of Cerebral Blood Flow and Metabolism, 10, pp.290-293.