✍️ Author: Dr Eleni Christoforidou
Home
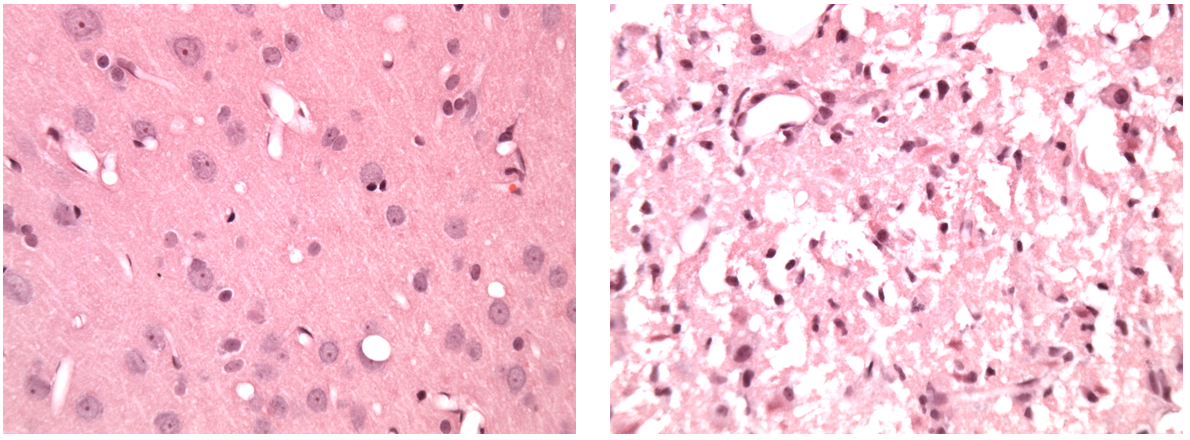
Light microscopic images (x40 magnification) of H&E-stained brain tissue post-stroke. The left image presents unaffected tissue from the ipsilateral hemisphere. The right image exhibits the infarct.

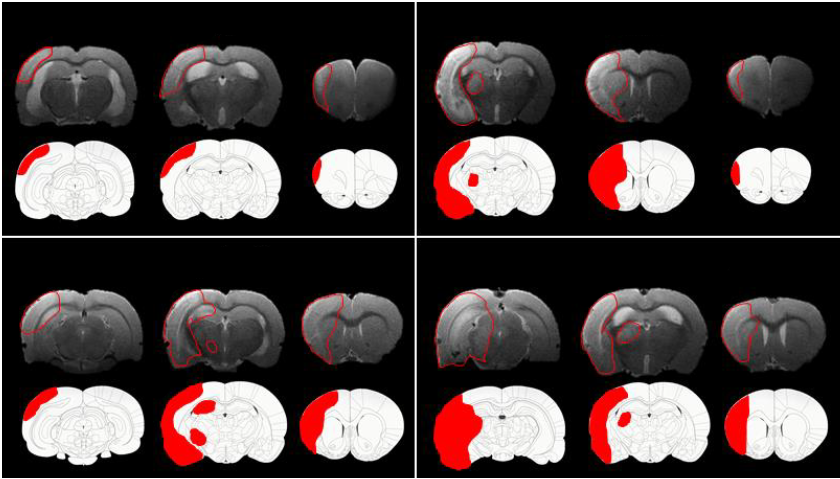
T2-weighted MRI images, 7 days post-stroke, alongside diagrams of corresponding coronal slices. The infarct area, observed via light microscopic examination of H&E-stained sections, was manually drawn onto the diagrams and is showcased in red.
A Day in the Lab: Decoding the Histopathological Alterations in Brain Slices Post-Stroke
🕒 Approximate reading time: 4 minutes
Today, I've been engrossed in studying H&E stained brain slices, attempting to unearth histopathological modifications in the aftermath of a stroke. H&E-stained brain tissue was scrutinised under a light microscope. The somas of healthy, unaffected neurons exhibited a round shape, with a distinctly visible nucleus. Contrarily, ischaemic neurons displayed a dark and shrunken appearance, coupled with pyknotic nuclei. Moreover, eosin staining appeared more muted and there was noticeable vacuolation of the neuropil. A significant infiltration of neutrophils was observed, and oedema was glaringly apparent. Below, I've included some of the images I captured using the microscope.
Timelapse: Observing the stained brain slices under a light microscope.


Unpacking the Methodology of Today's Experiment
The infarct area, as observed on H&E-stained sections under the light microscope, was manually transcribed onto diagrams of corresponding coronal slices from a brain atlas. These were subsequently scanned into a computer and scrutinised using image analysis software. The area of the drawn infarct was manually delineated, mirroring the method applied for T2-weighted MRI images, but without oedema correction. The infarct area from each diagram was compared with the oedema-corrected and uncorrected infarct areas from the corresponding slices from T2-weighted MRI images of the same brain, to evaluate the precision of infarct measurement from MRI images. Oedema-corrected infarct areas from T2-weighted images were calculated using formulas from previously published research. Lesion areas deduced from diagrams were significantly smaller than those calculated from T2-weighted images prior to oedema correction.